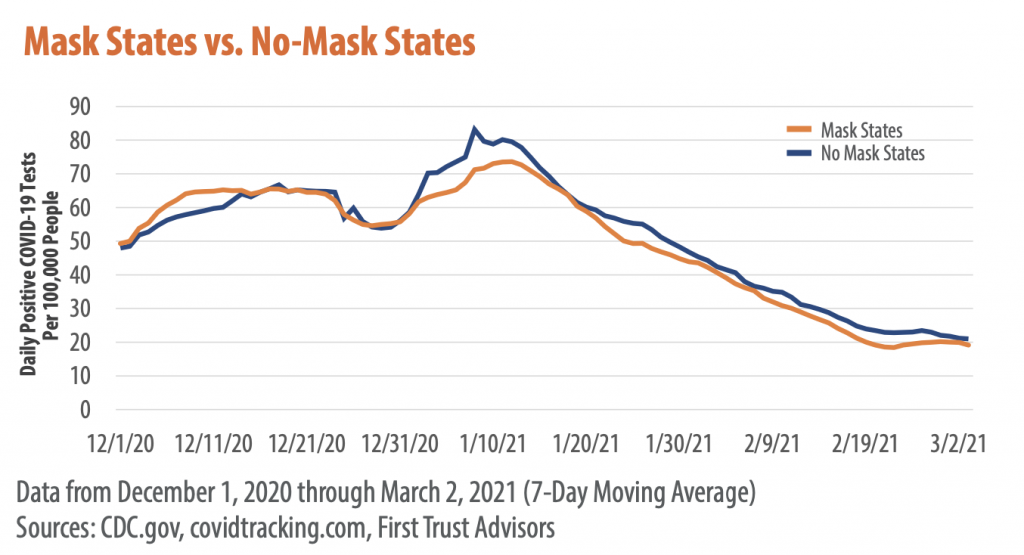
I would use a t-test to look into statistical differences between so-called mask mandates states and non-mask states because I thought I would compare two independent groups. However, the independent samples t-test is for the analysis to compare means between two groups. This analysis should be comparing two groups with different sizes over time, that is, to investigate how the patterns of two time-series groups are.
Also, I am still curious whether it is adequate to see only the average, despite the 7-day moving average used in the report, because the size of each group is different; for example, the numbers of states without mask mandates are sixteen. The variances in each group seem that the average isn’t enough to represent the group. So, to prove whether or not patterns are different between these two groups, more complicated statistical analyses are necessary. I may have a chance to analyze more. In this posting, I am comparing two groups by using regression graphs. Because I don’t find historical information of which states are in ones with/without mask mandates, I didn’t examine other periods than the report.

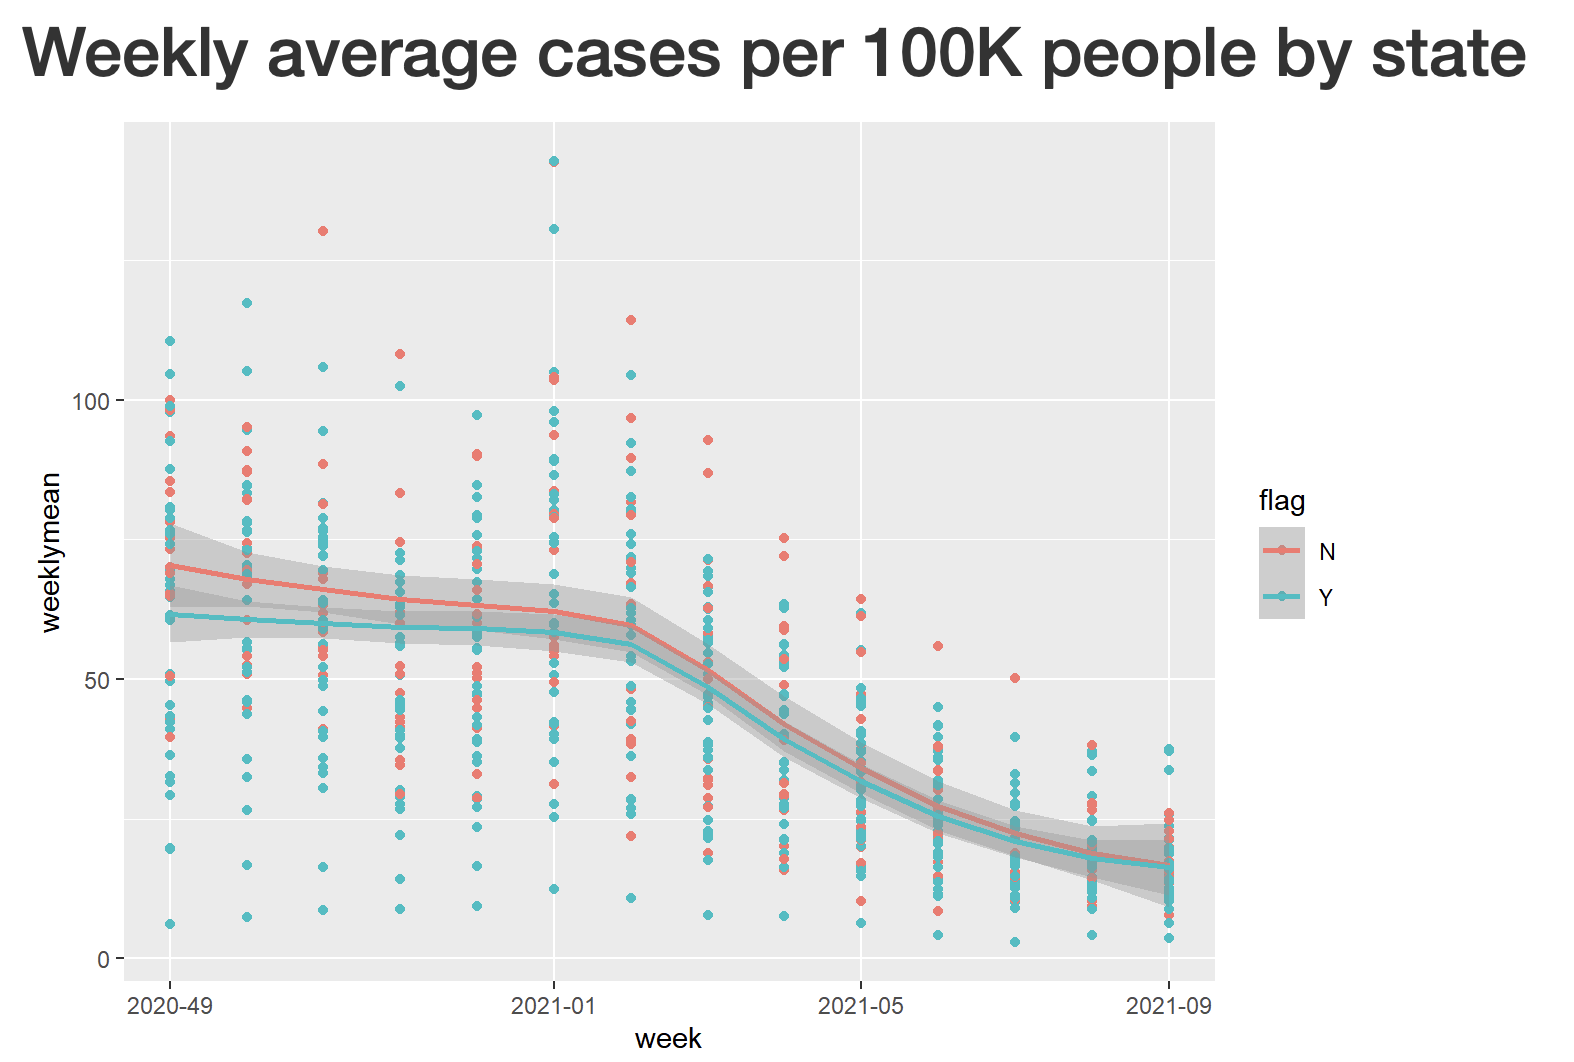
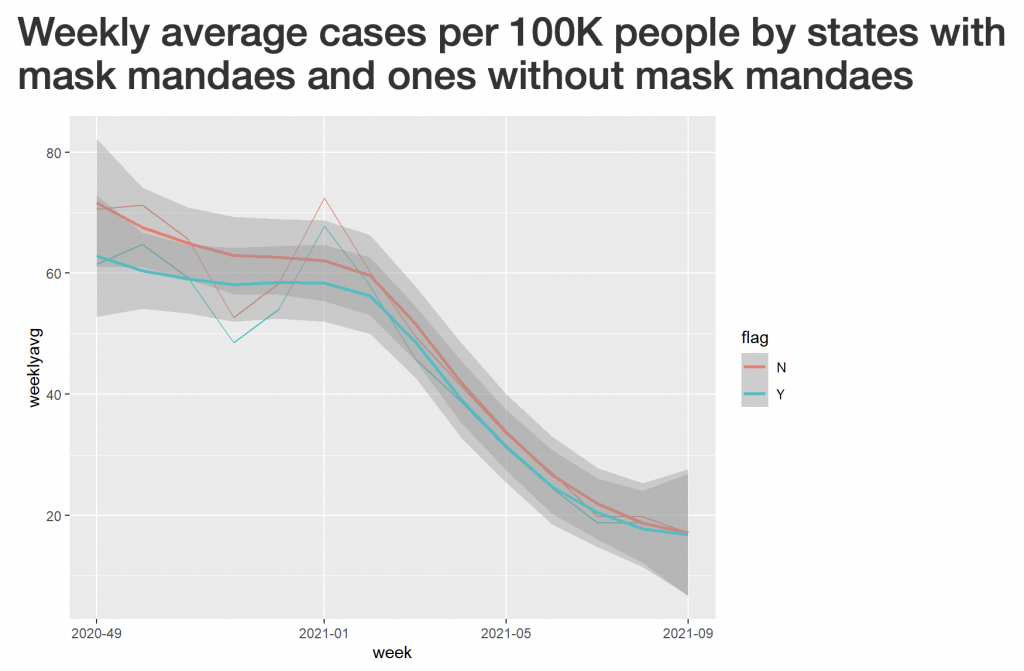
In the graph above, points are weekly average cases per 100K people of states, and lines show a polynomial regression with the LOESS method. The red line and dots are states without mask mandates, while the blue line and dots are states with mask mandates. Dots seem to distribute widely. So, see the lines. Although they look similar patterns, the red line, weekly average cases per 100K people in states without mask mandates, is located higher than the blue line. It means that there were more cases per 100K people in states without mask mandates than one with mask mandates. More analyses are needed to see if the gaps between the two groups are statistically significant.

In the report, the two groups look to have almost the same patterns. But in regression graphs, no mask states showed more cases than mask states; and the gaps became smaller over time. I don’t think it means the mask mandates policy in a state is meaningless or not valid anymore. Because there’s another factor to affect the case, that is vaccination. Although more analyses are necessary to prove this vaccination hypothesis, for example, adding how many people get vaccinated into this analysis would prove that measures based on strong scientific supports work well rather than the mask mandates policy don’t work or are useless.

It seems a little bit late to post this now. I began to edit this posting on 4/12 but didn’t complete it at that time because of some errands I had to do before this posting. If I had had enough time, I would have tried a Shiny app. Due to the two-week delay, I don’t decide yet to do it. I also attach an HTML file generated from the knit function on the RStudio. Please find it below. Additionally, I upload an RMD file to create the HTML file into my Github repository. If you have any questions, feel free to ask me.